Monday, December 31, 2007

An "Extraordinary" Happy New Year!


Hello and a very Happy New Year to you! I am sitting comfortably in Dunn Brothers in Apple Valley. A place that is fast becoming a favorite place to steal away for some time and a hot mug of coffee as well as a good place to create another edition of Radiant You. You may recall from reading my post about "Service" that I had felt a strong urge to tell the people of the Unitarian Church I attend that we are all radiant beings of light and that we need to be more aware of this instead of hiding our lights under a bushel. I felt the push to speak but I didn't. I made a promise in that blog to you but more importantly to me, that the next time I would get up and light a candle for everyone there. I am proud to say that I kept that promise. I stepped out of my comfort zone (oh yeah, it can be hard for me to do things like that). I spoke from
my heart to everyone. I didn't speak very long. If I said I spoke for two minutes, I would be exaggerating. But if it was one minute or ten, I spoke from my heart and said that we need to be proud of ourselves and to never for a moment think that our lives are what they are because of the road we travelled to get to where we are at this moment. The road ahead of us is still being paved and we can choose where we want to go in our lives. Afterward, many in the congregation came up and thanked me for talking to them. I feel that that was an unofficial ground breaking for "Radiant University". That was two Sundays ago. Yesterday at service we did an exercise on our experiences of the 2007. What we felt about our personal journeys and where we see ourselves in the next year.


As I was busy scrawling away with pen and hand, my initial reaction was one of disappointment that I hadn't achieved much. But as I contemplated about everything I had done, taking a big step out of my comfort zone and moving like I had and fulfilling my intention of meeting like minded spiritual people. As I told everyone there yesterday; "I came to the conclusion that my life doesn't suck as bad as I thought it did." Sure I am going through some challenges in my life that I want to change and I will, but my life now is pretty darned good. I am an amazing being of energy and light. Which brings me to Liz Phair.


Liz who? Phair. Who broke into the "Indy" music scene with her much acclaimed "Exile in Guyville". Phair's lyrics have often been described as erotic. She has toned much of that down in the ten years she has recorded but her lyrics still pack a punch. The song that has caught my attention in the past few days is "Extraordinary". It's about her challenge to herself to make the man in her life notice her that she is not average and boring. As the song begins, she is talking to herself more than him, something we all do while washing the dishes or in the produce section picking out fresh spinach:

You think that I go home at night

Take off my clothes, turn out the lights

But I burn letters that I write

To you, to make you love me

Yeah, I drive naked through the park

And run the stop sign in the dark

Stand in the street, yell out my heart

To make, to make you love me


Phair then tries to convince herself more than the object of her romantic intentions that she is someone that is exciting and vibrant.


I am extraordinary, if you'd ever get to know me

I am extraordinary, I am just your ordinary

Average every day sane psycho

Super-goddess

Average every day sane psycho


Liz soon becomes bolder as she confronts her boyfriend who thinks she is normal and thus, boring:


You may not believe in me

But I believe in you

So I still take the trash out

Does that make me too normal for you?

So dig a little deeper, cause

You still don't get it yet

See me lickin' my lips, need a primitive fix

And I'll make,

I'll make you love me


Now our heroine really starts to feel good about herself she belts out the chorus and adds even more emphasis on the words highlighted in red:


I am extraordinary, if you'd ever get to know me

I am extraordinary,

I am just your ordinary

Average every day sane psycho

Super-goddess

Average every day sane psycho

Super-goddess


Phair really understands her radiance now. She is done trying to impress someone else and knows she doesn't need to impress herself:


See me jump through hoops for you

You stand there watching me performing

What exactly do you do?

Have you ever thought it's you that's boring?

Who the hell are you?


I am extraordinary, if you'd ever get to know me

I am extraordinary,

I am just your ordinary

Average every day sane psycho

Super goddess

Average every day sane psycho.


I love this song because it's the way we should all feel about ourselves, that even as we go through the mundane of taking the trash out. We are all extraordinary super goddess' and super gods.


My intention for this new year is to continue to build on "Radiant You" and"Radiant University" as places to come to to help you and everyone to know that we are amazing spiritual beings created from Love and that being an "Average everyday sane psycho" is a good thing especially when we truly understand how truly vibrant and extraordinary we are.


I send you all love.
"Extraordinary" words and music by Liz Phair
My thanks to Sarae for her photo of Liz Phair.
To Make A Resolution?

An update from OurUltimateDate.com

It’s that time of year, isn’t it? That time when you look back over where you’ve been and where you want to go, add it all up... And make resolutions, or not. So I’m going to time-warp back to this exact time last year: end 2006/start 2007:

I was five months into my experiment called AreYouMyWife. I had been on about 30 dates all over the world, had left my job, and I was living in my own self-started story: impulsive, imaginative, open horizons, tethered no where. From the outside it appeared that I was on a carefree road trip, but at some point on any road trip the fuel does run out. And I was on a plane.

Yep, I wasn’t with friends or family (or on a date) raising a champagne flute, I was somewhere over the Atlantic ocean as 2006 transitioned into 2007. And that was because it was the only time I could get on a standby flight back to London where I still had my material possessions and paid rent, but no job. My fuel tank was on “E”.

At this time last year I had almost ended AreYouMyWife as I considered four major life changing choices – two stable, two unstable. I made my choice, and almost felt foolish. But in the end, I met CeCe… and then promptly left for Australia.

So here we are: 2008. I’m in London, having gone a full circuit around the world to end up back where I started. I’ve just had my first Xmas with CeCe and her family. I now share an apartment with her, and bills, and I have a full time job, and we’re giving ourselves time to see how we go.

What a year it’s been: one of the most successful of my life to date, but also one of the most unpredictable and draining. So in looking back, I have to ask myself: do I have any regrets?

For now, I certainly don’t, especially after taking a step towards one of our OUDBOD dreams by bringing out The AreYouMyWife Story… Bite Size.

But I may well have regrets this time next year, if I’m not careful. The thing on my mind going forward is marriage… but not between CeCe and I just yet… We still have a long way to go on that front.

I’m hoping to marry the impulsive, imaginative story I once lived with the stable reality I’m currently living. I want to balance the creative with the routine, the road-trip with being stationary. That is a big hint as to what is behind the Door on Are-You-My.com.

As for new year’s resolutions, I don’t believe in those. You either do, or you don’t. You either talk about something, or you act on it.

This time next year I’ll be reflecting once again. And I wonder how it will all look in the rear-view mirror: a regret? Or a triumph? I guess we’ll see.

Happy new year everyone!

Sunday, December 23, 2007

Radon in the Home

Over 40,000 people in the United States and Europe die each year from lung cancer caused by exposure to radon gas.

Most of these people are exposed to radon in the home. And yet, the majority of them are unaware of the health risks posed by radon, unaware that their home has dangerously elevated levels of radon, and, probably, unaware of what radon even is.

Part of the fault lies with governments and health organizations, which have failed to respond appropriately to so many deaths. Information about radon gas is not as widespread as it should be (although the situation is improving). But, part of the problem lies also with the homeowner: it's your home and your health. Educate yourself!

Because you can't see, smell, or taste radon, in order to find out whether or not it's in your home—and how much of it there is—you have to test for it. Tests are cheap and easy to administer. They're available online, even from sites like Amazon.

Finding out whether there is an elevated radon concentration in your home is your responsibility. Why? Because shirking this responsibility will hurt only you.

Car accidents close roads, slow down the flow of business; airborne diseases can affect anyone; and guns pose a physical threat to the government. Hence, there are initiatives to cut down on these problems.

With radon, it hurts only you. And, as callous as it sounds, it's more profitable for health care providers to treat you when get lung cancer than to prevent it in the first place.

So, take charge: call the Environmental Protection Agency (EPA), or an equivalent in your country, get the proper information, test your home, and take appropriate action. Simply because no one's actively helping you, doesn't mean they're actively trying to stop you. The truth is, they just don't care.

So: you care.

What are safe radon levels?

Unfortunately, we're not sure. On one hand, since radon doesn't have any health benefits, the ideal safe radon level is zero: no radon exposure. On the other hand, there are levels under which exposure to radon, while not good, is rather negligible.

What is this boundary between negligible and harmful or lung cancer causing?

That depends on which experts you ask!

In the United States, for example, the Environmental Protection Agency (EPA) deems the limit, expressed as maximum exposure per year, to be 148 Bq/m^3.

In Britain, and across the European Union, the limit is slightly higher: 200 Bq/m^3.

While, in Canada, the dividing line between safe and harmful is much higher. Canadians, according to Health Canada, are safe unless they're exposed to more than 800 Bq/m^3!

In other words, we don't quite know what the magic number is. Or if there even is one.

But, erring on the side of caution—in this case the US number—seems like the sensible thing to do, whether you're in the US, Britain or Canada. It's your health, after all.

Saturday, December 22, 2007

Radon Test Kits on Amazon

Some people don't know where to look for radon test kits. Hence, they don't test their homes. Because radon awareness is such a low priority, most us of don't realize that the kits are even available at the same online spot we buy DVDs and books: Amazon.

Amazon's stock of radon test kits includes:


I'm not sure how good any of these are because I haven't used them, but the important thing is that they're available at the click of a button. It's important to at least be aware of that.

Free Radon Test Kit in Texas

The Texas Department of State Health Services (DSHS) is now offering free short term radon test kits for state residents.

According to the US Enivornmental Protection Agency (EPA), radon levels in Texas are quite low, and only a few areas have even a "moderate radon potential". But, you sure can't beat free. I mean, even the envelope you get with the kit to send in your test for interpretation of results has it's postage paid!

There's really no reason not to get and use the test kit.

So, if you're a Texan, contact the DSHS for more information. Their free phone number is 1-800-293-0753. Or, you can email them.

Friday, December 21, 2007

Childhood Depression and Self Injury

When I was in graduate school one of my first clients was a woman who came in to talk about her depression. At her second session she confided that she was worried about her 3 year old son who was belligerent and often banged his head when he was frustrated. At the time I didn't really know what to make of it and I suggested that she take him to his pediatrician to be assessed for autism.

Because I was only a student therapist and she only had a few sessions with me, I never learned the outcome of her son's doctor visit.

If she were to come to see me now I would do things differently. I would have her bring her son in to be assessed for depression. We now know that depression can have strong familial and genetic ties. We also know that even very little children can suffer with depression. But because children are not verbally or emotionally sophisticated they show symptoms of depression in very different ways from adults. Both parents and pediatricians can miss the child's cries for help.

Children, even infants, have feelings of anger, frustration, stress and depression. But they don't know how to adequately communicate their feelings. Consequently their frustration and anxiety increases even further and they degenerate into an emotional heap; throwing a tantrum, screaming, hitting themselves in the head and throwing themselves onto the floor.

Parents become perplexed and worry that their child may be turning into a brat. Not so. Just as with adults, depression in children causes them to feel unheard, unloved and unworthy of love. The emotional pain of feeling unlovable is so great that they distract themselves from their emotional pain by focusing on creating physical pain.

If the child's depression and feelings of worthlessness go unchecked they may grow into teens and adults who begin cutting themselves, getting involved in masochistic sexual relationships or taking drugs, attempting to use physical pain as a distraction from their intense emotional pain.

If you have a child or infant who is frequently tantruming, banging their head, hitting themselves or otherwise causing themselves physical pain, take them to see a clinical psychologist who is well versed in childhood depression, to be assessed. Even if your family dynamics are such that they are contributing to the child's unhappy behavior, it is important to learn if there is a genetic component as well.

Don't be too quick to label your child belligerent or bratty. Punishing this behavior only validates the child's feelings of worthlessness and increases their anger and frustration. Depression isn't a choice. However you, the parent, can choose to help your suffering child.

Thursday, December 20, 2007

What is radon mitigation?

Radon mitigation is the process by which you lower the amount of radon in your home.

It's a simple concept that's intentionally been made more imposing by a serious-sounding piece of jargon, usually to convince you that you need a professional to do it for you. But, even though the term mitigation itself may sound complex and technical, it just means an act that lessens or moderates—in this case, radon gas.

Radon mitigation could just as well have been called radon mellowing. Sounds better already, doesn't it?

So, always remember that while there are retailers and professionals who will claim that there is only one way to lower radon—and some will claim "radon mitigation" as a singular patented process which only they can legally provide—this isn't the case. Radon mitigation is a bit like dieting: there are many ways of doing it!

Hence, radon can be "mitigated" using various methods.

First, you can seal the cracks and crannies through which the radon gets into your home. Comb your basement floors and walls for unwanted openings, grab a concrete crack repair kit, and away you go. Sound simple? It is. And, more importantly, if less radon gets into your home, then less radon gets into your lungs, and you have a lower your risk of developing lung cancer.

Second, if you can't lessen the amount of radon gas entering your home, you can speed up the rate by which it leaves. The key here is ventilation. You can do this the easy way, and achieve some results by opening windows, using fans, creating and taking advantage of drafts; or, you can do it the more direct way, and actually increase the power and effectiveness of your home's ventilation system. These upgrades run from about $1000 - $3000 a pop, but they do work.

Other creative methods of reducing radon gas in your house are soil suction, which attempts to suck the radon out from beneath your home, thereby decreasing the amount of gas that does get inside, and home pressurization, another jargon-laden term that basically refers to creating a pressure difference between the exterior and interior of your home so that radon is pushed back rather than sucked in. Basically, if you can think back to high school physics and remember how gases interact with one another, you can apply that knowledge to the problem of radon. It's not an impossible problem to understand; it's just an unwanted gas.

Which type of radon mitigation you need depends on your particular situation, but sealing cracks and opening windows is always a good idea, regardless. For more information, please take advantage of your government's health services. After all, you pay the taxes, so take advantage of what they're used for!

The AreYouMyWife Story… Bite Size

An update from OurUltimateDate.com

The AreYouMyWife Story… Bite Size

A major victory is now tangible for you to own! CeCe and I have produced a coffee table book about the AreYouMyWife journey. I'll tell you all about it in this video:


AreYouMyWife Video#67 – Bite Size!

(Video not working? Click here)

If you want to read the backcover, click here


HOW TO GET IT

The book comes in three sizes, is printed on demand at Blurb.com and can be ordered in £, $ or €.


Option#1 – Through yours truly

1) Email me on areyoumywife@gmail.com, cut and paste the italicized A-to-E text below into your message and fill in:

A) Which book size(s) you want (7x7" 10x8" 13x11"), and in softcover/hardcover
B) Quantity
C) Your full shipping address with postal/ZIP code and country
D) Preferred currency: £, $ or €
E) How you wish to pay: Cheque, bank transfer, credit card/paypal (link below) or cash – if you’re in London.


2) I’ll email you back total cost and shipping options.

3) Once we arrange payment, I’ll place your order for you and email you the confirmation and tracking numbers.

Option#2 – Direct from Blurb with credit card

Blurb will make this function available only in late January 2008


***
For those who have already made arrangements with me under option#1, click the PayPal button to pay via credit card:

The AreYouMyWife Story… Bite Size

An update from OurUltimateDate.com

The AreYouMyWife Story… Bite Size

A major victory is now tangible for you to own! CeCe and I have produced a coffee table book about the AreYouMyWife journey. I'll tell you all about it in this video:


AreYouMyWife Video#67 – Bite Size!

(Video not working? Click here)

If you want to read the backcover, click here


HOW TO GET IT

The book comes in three sizes, is printed on demand at Blurb.com and can be ordered in £, $ or €.


Option#1 – Through yours truly

1) Email me on areyoumywife@gmail.com, cut and paste the italicized A-to-E text below into your message and fill in:

A) Which book size(s) you want (7x7" 10x8" 13x11"), and in softcover/hardcover
B) Quantity
C) Your full shipping address with postal/ZIP code and country
D) Preferred currency: £, $ or €
E) How you wish to pay: Cheque, bank transfer, credit card/paypal (link below) or cash – if you’re in London.


2) I’ll email you back total cost and shipping options.

3) Once we arrange payment, I’ll place your order for you and email you the confirmation and tracking numbers.

Option#2 – Direct from Blurb with credit card

Blurb will make this function available only in late January 2008


***
For those who have already made arrangements with me under option#1, click the PayPal button to pay via credit card:

Wednesday, December 19, 2007

Radon Gas Map: N. Ireland

The Isles are becoming complete. We now have radon maps for England, Wales, and Northern Ireland!

In addition, there's also the United States radon map.

Radon Gas Map: N. Ireland

The Isles are becoming complete. We now have radon maps for England, Wales, and Northern Ireland!

In addition, there's also the United States radon map.

Radon Gas Map: Ireland

In addition to the radon maps of England/Wales and the United States, there's now a radon gas map for Ireland. It's divided into provinces, and is fairly detailed. The Irish are one of the leading nations in the "fight against radon".

Update: we now have a radon map for Northern Ireland, too!

Radon Gas Map: USA

The U.S. Environmental Protection Agency (EPA) has issued a radon risk assessment map that shows which areas of the United States are more likely to have dangerously high radon levels.

The map is divided into three types of "zones": high potential, moderate potential, and low potential. While this is fine for people living in the high and low zones, those in the moderate zones will probably want to know whether they're just above the low or just below the high!

Still, it's a useful visual guide. And all Americans are encouraged to have a look.

The radon gas map of the USA is available here.

If there are general conclusions to be drawn from the data, they're very basic: the Southeast (most of Texas, Florida, etc.) is the most radon free while the more dangerous radon areas are clustered toward the North, near the Canadian border.

Incidentally, if any Canadians are reading, though the map doesn't cover Canada, the results suggest that Canadians living near the US border (most of you!) are in a high risk radon area.

As for English-speaking Europeans, there are similar map available for England, Wales, Ireland, and Northern Ireland.

Radon Gas Map: UK

UKradon, a British company that sells "Radon Risk Reports", has created a helpful and eye-opening map of England and Wales (Sorry, Scotland!) that shows which areas in the two countries are most afflicted by dangerous levels of radon gas.

You can see the UK radon map here.

In general, the Western parts of the Isle are much more prone to radon than the Eastern parts, which are relatively free of radon risk, according to the map. North and South appear relatively equal.

Overall, Southeast England has the most dangerous levels of radon gas: over 30% of homes in this area have radon problems!

But, if you live anywhere in England or Wales, I suggest you take a look at the map for yourself.

Update: we now have a radon map for Northern Ireland, too!

Step #4: Thank God for the egen Command

Introduction

What's so special, really, about the egen (extensions to genereate) command? The answer is that it lets you do lots of things to the data. Things that in other statistical programs might take a lot of commands are possible to do with a couple of egen commands. So this is actually the next phase of data manipulation.

The syntax is pretty simple:

egen <new variable>= <function>(<expression(s)> or <variable(s)>) [, by (<variables>)]

The functions actually determine what the egen command will do. There are many of them, all described in help egen, and the following sectios of this step will describe the use of the most commonly used functions. These examples will hopefully clarify how to use the different functions and how can they help us.

mean()

egen store_mean_price = mean(price), by(store_id)

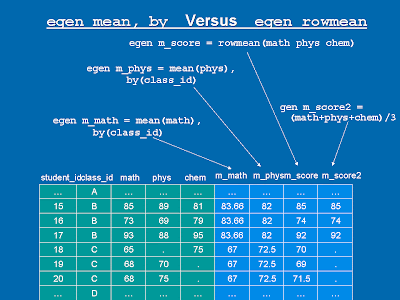
This example will create a variable in which, for each observation, the value will be the mean price of all observations that have the same store_id. See the figure under rowmean() for a graphic illustration.

One can omit the by option - this will put the mean of the original variable for all observations in the dataset.

Other examples:
egen mean_firm_occupation_wage = mean(wage), by(firm_id occupation_id)

This will put, for each observation, the mean wage of all other observatios with the same firm_id and occupation_id.


rowmean()

The function rowmean also compute means, but instead of computing means of a variable across observations, it compute the mean across variables for each of the observations.

egen mean_score = rowmean(math_score physics_score chemistry_score)

Suppose you had a dataset of students and their scores. This example will simply create a new variable - mean_score - which will hold the mean of math, physics and chemistry score for each of the students.

Note that the fact that it computes it separately for each of the observations makes the by option irrelevant. Take the previous example: There's no meaning to do add a by(class_id) option to the egen command when using the rowmeanfunction. If you want the mean score in class for any of the subjects (mean score across students), you should use the mean() function instead of the rowmean(). If you want the mean score (across students) of the mean score (across subjects), you need to first do mean and then rowmean (or vice versa).

You might ask, what's the difference between the rowmean() and simply using the gen command:

gen mean_score = (math_score + physics_score + chemistry_score) / 3

There are two main differences:
1. You can use wildcards - The same rowmean command can be written like this:

egen mean_score = rowmean(*_score)

This is very useful if the list of valiables is very long, or if you think that later on you might add english_score history_score, and so on, to your dataset, and you don't want to update this command every time. To learn more about wildcards, see help varlist.

2. Missing values - If one of the variables mentioned above is missing, gen command will not be able to sum the three variables and will therefore put missing value for mean_score in that observation. This is the case even if the other two scores are not missing. egen rowmean, on the other hand, will disregard the missing values and compute the mean of only the nonmissing values in the variable list. Only if there are missing values in all of the variables specified, egen rowmean will put missing value in the generated variable (just like the gen command). It's up to you to decide which one is better. Sometimes it is enough to have one missing value in order for the mean value to be irrelevant to what you are measuring, and sometimes you may decide that the mean of the nonmissing variables only is good enough.


This slide shows how the mean() and rowmean() functions work:


Note: Although the observations are sorted according to the by variable (class_id) here, it doesn't mean that you should sort them before. egen doesn't need the dataset to be sorted according to the by variable (although I'm guessing that if it's sorted, it will take less time to process).

sum() and rowtotal(), max() and rowmax(), min() and rowmin()

This is the same as mean and rowmean, but instead of calculating means, these functions calculate sums. Here are some examples:

egen team_effort = sum(effort), by(team)
egen total_correct_answers = rowtotal(question_*)

There is a small difference between rowmean and rowtotal in the way missing values are treated. rowtotal simply treats missing values as zeroes. So even if the values are missing in all the specified variables, the new rowtotal variable will be 0. rowmean would have put missing value instead. If you want to put a missing value there, you might want to do something like that:

egen total_correct_answers = rowtotal(question_*)
egen nonmissing_answers = rownonmiss(question_*) // This function puts the number of variables for which this observation had a missing value
replace total_correct_answers = . if nonmissing_answers == 0
drop nonmissing_answers

For max and min, the function gives the maximum or minimum value, respectively, out of all the values of the specified variable (within a group, if you are specifying the by option). Let's say, for example, that you want to normalize all values of the variable wage in a group so that each observation will have 1 if its wage is the maximum wage in a group, 0 if its wage is the minimum and some number between 0 and 1 if it's in between. The following set of commands will do the job pretty easily:

egen max_wage_f = max(wage), by(firm)
egen min_wage_f = min(wage), by(firm)

gen norm_wage_f = (wage - min_wage_f) / (max_wage_f - min_wage_f)
replace norm_wage_f = 0.5 if norm_wage_f == . // This is for the firms in which the maximum wage equals the minimum wage. The command above will give them missing values, because the denominator equals zero


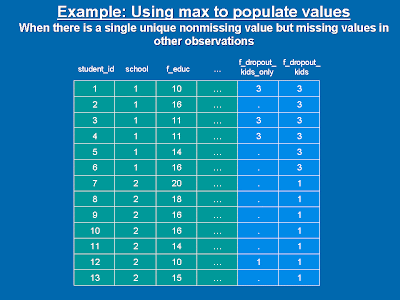
Here is another example of using egen max in order to populate a nonmissing value to observations with missing values. Suppose you have a dataset of students in schools. In one of your regressions you want to take into account the number of children whose father dropped out of high school. In order to do so, you will the following commands:

egen f_dropout_kids_only = count(student_id) if f_educ<12, by(school) // This will count the number of children for whom the condition applies. Observations in which the condition does not apply, will get a missing value to the generated variable.

egen f_dropout_kids = max(f_dropout_kids_only), by(school)

drop f_dropout_kids_only // Don't get confused. This will drop the variable f_dropout_kids_only that is no longer needed

Although, in general, missing value is greater than any other nonmissing value, the egen max ignores missing values and therefore the observations with the nonmissing value in that school - i.e the kids whose father dropped out - will be given to the other observations in the same school (we need all of them in the regression: both the ones who apply and the ones who doesn't). The following figure might make it clearer.


Note: Instead of egen max, we could have also used egen min or egen mean again as the second command. Both egen min and egen mean ignore missing values and since the nonmissing values are equal for that by category, the functions will yield that same value. This is not true for egen sum, though, because the sum function will multiply the nonmissing value by the number of nonmissing observations.


For additional statistical calculations of the within group, see help egen and look for functions such as sd() (for standard deviation), median(), mode() and others. You can also calculate statistics across a group of variables on an observation-basis (instead of across a group of observations on a variable-basis). See help egen and look for the functions that start with row : rowmean(), rowmin(), rowmax(), rowsd(), rowtotal(), etc.

tag() and group()


These two function are really useful with identifying variables that have more than one observation (group-identifying variables) - the same ones we used before in the by options.

Suppose you have a dataset of gas prices. Each observation has the type of fuel, the price per gallon, the station ID, and week in which the price was recorded. Not all stations were recorded in each of the weeks. That is, in some weeks, some stations didn't have their price taken. In your research, you decide to work only on stations for which you have full data - i.e, those which appear in each of the 50 weeks.

If the data had only one observation per station-and-week combination, you could have just used the count() function of egen:

egen station_count = count(week), by(station) // This will count the number of observations with non-missing values in week, for each value of station, and put the result for each observation of that station.

The problem is that each station-week combination has more than one observation and the number of observations per station-week varies between stations (remember, each station-week has as many observations as the number of fuel types - a price for leaded, unleaded, premium, etc.). Simply counting observations will not work here. We need to "tag" stations: in other words, we will create an indicator (a dummy variable) which will be 1 for only one observation per station, and 0 for all other observations of the same station.

Once we tag each new combination of station-week, we can count how many station-week combinations there are for each station -- this will give us the number of weeks for each station. Although I said we need to count, we will use the sum() function of egen, because count() will add to the count observations with 0, whereas sum will not (which is good because we do not want to count the same station-week more than once):

egen station_week_tag = tag(station week) // We're not using the by option since the group-identifying variables are already in the tag.

egen weeks_of_station = sum(station_week_tag), by(station)

Graphically, this is what we actually do:


The group() function is used in the same manner we use the tag() function, but instead of putting 1 in each new combination and 0 in combinations that it has already seen, it puts 1 for all the observations of the first combination it sees, then 2 for all the observations of the second combination, and so on. The benefit of this function is that you can create a full numeric ordered single variable that enumerates all combinations. When we will deal with loops, it might be clearer why this is good.


Conclusion

The egen command can help you play with the data pretty easily and intuitively (once you get the trick of the function you are using). There are other functions of egen I did not describe here. As I said, you can use the help egen, and don't be afraid to experiment with the functions.

To check whether your function work, browse your dataset. Sort it first by the group variables you mentioned, and then just browse the variables you want to. If you have a large dataset, you can limit the browse command using if conditions or in. Here are two examples:

sort firm

browse firm employee wage min_wage_f max_wage_f norm_wage_f in 2000/2200 // This will browse observations #2000 through #2200

browse firm employee wage *_wage_f if firm >= 100 & firm <= 200

You can do the same with the list command, by the way (but list is limited to the width of the output screen).


Good luck!

(Go on to Step #5)