Sunday, July 31, 2011

Snail Mail My Email

What a fantastic project.

I doubt I could tell the story better than Ivan and the rest of the crew could so here it is in their own words:

"Snail Mail My Email is a month-long (July 15 - August 15), interactive community art project which seeks to both share the warm-fuzzy feeling of receiving a personalized letter as well as inspire people to send their own snail mail. Anyone with internet access can partake by simply sending an email, after which the very same message will be handwritten and physically mailed to the chosen recipient anywhere in the world, completely free of charge."


Snail Mail My Email

What a fantastic project.

I doubt I could tell the story better than Ivan and the rest of the crew could so here it is in their own words:

"Snail Mail My Email is a month-long (July 15 - August 15), interactive community art project which seeks to both share the warm-fuzzy feeling of receiving a personalized letter as well as inspire people to send their own snail mail. Anyone with internet access can partake by simply sending an email, after which the very same message will be handwritten and physically mailed to the chosen recipient anywhere in the world, completely free of charge."


Saturday, July 30, 2011

Introduction

Hi everyone! We are a group of students from Diagnostic Radiography and this is our blog made for our statistics project. Our group members consist of Nur Fadilah Mahyudin, Yi Xuan, Xin Hui, Yan Wei (Jodie), Hui Ting and Sabree.

We racked our heads over what research topic we should base our project on, because we wanted to find a topic in close relation to our future career where we could see ourselves applying the knowledge gathered from this project. After much deliberation, we chose to explore the hypothesis of whether one's blood pressure would be directly proportional to their height. The results of our findings would be extremely helpful towards angiography (examination of x-ray of blood or lymph vessels, carried out after introduction of a radio-opaque substance) and arterial surgeries, where timings of systolic and diastolic pressure have a great impact on success rates.

First off, let us guide you through what we were headed out to do.

What we want to know:
To find out the relationship between height and blood pressure (sub-divided to systolic and diastolic pressures).

Common medical words you will be seeing throughout the blog:

Systolic pressure
Highest arterial pressure during each heart beat.

Diastolic pressure
Lowest pressure within the arterial blood stream occurring during each heart beat.

How we carried out the collection of data:
We used 2 sphygmomanometers to collect blood pressures of our subjects, while 2 generic measuring tapes were used to measure their height. Collection of data was done within a day.

Range of data:
Height – 150 to 180 cm (both males and females)
Healthy systolic/diastolic pressure range – 120/80 mm Hg

Thus, this is the hypothesis we have come up with:

Height vs Diastolic & Systolic Pressures
H0: There is no relationship between a person's height and his/her diastolic & systolic pressures.
H1: There is a relationship between a person's height and his/her diastolic & systolic pressures.

Click on the tabs on the left to find out more and feel free to drop a comment on our tagboard! :)

Reflections

Lim Hui Ting

At the start of the semester, I have to admit that I was completely lost in the world of statistics. I felt like I was thrown in a cauldron of formulae and SPSS data, and had to put in immense efforts to put myself in the right direction. Thanks to the school lectures and tutorials, and help from my coursemates, the information in the coursebook slowly made sense to me. This project greatly enhanced my understanding of statistics as well. It was challenging, especially in the beginning when I had no clue how to go about with the project. Nevertheless, together with my project mates, we conducted the data collection very successfully and that was a great boost for morale. However, we hit a bump after we collated our data and realized that our primary hypothesis had no correlation! Luckily all was not lost. We took Miss Chia’s advice and went a different direction with our secondary hypothesis, and that worked out well. All in all, it was a great experience that opened my eyes to all the intricate steps that matter in data collection. Needless to say, I have also gained newfound respect for statisticians because I never knew there was an amazing amount of things to account for and take note of in the entire process of collecting data. Kudos to all statisticians out there!


Sabree Abdul Rahim

I had always thought statistics to be a boring and mundane subject, but when I went through this module, I realise that it was important especially when it comes to collating data and interpreting them.  It started off as a very simple concept at first: collecting 2 data variables (Height and Blood Pressure). In my honest opinion, the collection of data was by far the easiest part. The hard part was trying to interpret the data and coming up with a hypothesis for it. Fortunately, with the guiding hand of our lecturer, Ms Chia, we are able to come up with a suitable hypothesis for the results which we have gathered. Thus, our efforts were not in vain. Aside from the collection and interpretation of the data, this module has taught me a valuable skill with which I can use in the future, such as for the Final Year Project. The skills that I have learnt in this module such as the understanding on how to use SPSS programme will surely come in handy whenever I am doing future group projects. All in all, it had been a fun and interesting learning experience going through this module and this project with my group members.  


Nur Fadilah Mahyudin

Learning Statistics again in my Poly life reminds me of my JC days when I was first exposed to the world of Statistics and got to know about Hypothesis Testing, Probability etc. during H1 Maths lessons. I always look forward to learning this particular module as it amazes me that certain concepts like Pearson's R can help me solve questions such as, "Is there a relationship between a person's height and weight?" I am so thankful that my teammates and I were given the opportunity to apply what we have learnt from this module to come up with a project that was worth every minute spent on it. The collection of data from 30 subjects was by far the easiest task and generation and interpretation of the graphs and tables were made easy with the use of the brilliant SPSS software. However, we did face a hiccup when our hypothesis fail to prove that there is a relationship between a person's height and blood pressure. Nontheless, Ms Chia gave us the reassurance that all hope was not lost when she guided us to come up with an alternative hypothesis. The end result of this entire project gave me a sense of satisfaction that all the hardwork that my teammates and I have put in was worthwhile. For once in my life, I could be a mini researcher and I've learnt to appreciate statistics' journals better whenever I come across them in newspapers or the internet =)   


Tan Xin Hui

“Lymph node removal not needed for some breast cancer patients”
“Coffee may help protect against liver cancer”
“About 90% of Singaporeans are lactose intolerant to varying degrees”

Headlines like these usually capture my interest and I’m always fascinated by how the researchers in the studies managed to get a sufficient number of participants and how much time they would have to spend to come up with these conclusions. The collection of data for our statistics project was rather smooth as we worked well together and had the subjects and equipment that we needed, but it made me ponder upon the difficulties that researchers faced in real-life. The effort and time that some spend trying to prove a hypothesis may eventually come to naught (somewhat similar to what happened to us when there was no significant relationship between height and blood pressure. Ah well =/ ), or it may be difficult to find willing participants to take part in the project in the name of science. Nonetheless, I’m glad I had the chance to play the role of a researcher and it really makes me appreciate the effort that has gone into the studies that I read about in the newspapers.


Chai Yan Wei (Jodie)

The whole module was quite challenging yet fun at the same time. The fun part was to really investigate and conduct the experiment with our coursemates.  The conducting of experiment went on very smoothly and was successful. We chose to conduct our experiments during our break time as our coursemates were all in a relaxed mode which was crucial for our blood pressure experiment. The challenging part was probably the theory part. I was never good at statistics however the statistics book really aid in my understanding for statistics. I was especially thankful for the book gave step by step tutorial on learning theories like how to do a histogram etc. The book made statistics seem so much easier!  I am sure that statistics will help me in the future with other projects especially the year 3 final project. Overall, I had benefitted in many ways through statistics module.


Tan Yi Xuan

Everything starts from an idea. At first sight, the project seems simple enough with just data collection, using spss to generate the findings for analyze. Yet, during the execution, I realized there were many small little details to work on, as these little discrepancies would alter the test results and thus the credibility would be affected. Such examples would include the calibration of the tools used such as sphygmomanometers and measuring tapes. The choice of candidates was also important in order to have a good sample size, as this would determine the variables and the constants. Unfortunately, (to my horror!) the test results did not coincide and we had to go back to the basics to look at the hypothesis, the data and to make changes from there (looking for the silver lining!) and eventually the task was completed. The final analysis was completely different from what we had initially planned, yet the twists and turns of the event had made me benefit tremendously from this project. It has taught me that it takes determination and preservation to prove a hypothesis. Good knowledge on statics and spss will help to maximize the interpretation of the data and we may be able to derive more relationship from it. It is a great pleasure to work with good team mates whom we can get together to brainstorms for ideas and solutions and with Ms Chia's help, these have definitely enable me to get more comfortable in understanding statics. So for next time, I will be able to appreciate better of the statistical data presented in the journals, rather them brushing them away as plainly numbers and figures. :)

Data Analysis

After taking the required measurements from our 30 subjects, we computed the data into a SPSS file to generate graphs and tables. This was to aid us in our investigations as to whether there is a relationship between a person's height and his/her diastolic and systolic pressures.

First of all, we state the Null Hypothesis (H0): There is no relationship between a person's height and his/her diastolic and systolic pressures.

The Alternative Hypothesis (H1):There is a relationship between a person's height and his/her diastolic and systolic pressures.

Next, we identify the variables:
Height - A Scale data type
Diastolic & Systolic Pressures - A Scale data type

We then proposed Pearson's R as an appropriate technique to test H0 because our objective is to find the relationship between the 2 scale variables.

Let's examine the scatter plot to ascertain if the relationship is linear.

Here is our raw data table...


Then, using the data from the tables above, we generated the Diastolic Pressure vs Height's graph and table...


From the diagram, a Pearson’s correlation coefficient of 0.414 indicates there is a positive, moderate and significant association between a person's diastolic pressure and height. Pearson’s r = 0.414, p < 0.05, N = 30

o The null hypothesis (H0) is rejected.

Next, we generated the Systolic Pressure vs Height's graph and table...


From the diagram, a Pearson’s correlation coefficient of 0.501 indicates there is a positive, moderate and significant association between a person's systolic pressure and height. Pearson’s r = 0.501, p < 0.05, N = 30

The null hypothesis (H0) is rejected.

The null hypothesis H0 is rejected for both Diastolic Pressure vs Height and Systolic Pressure vs Height. Due to the moderate relationship for both Diastolic and Systolic Pressures against Height, we decided to find out if there is a stronger relationship from our data. Therefore, we have decided to see whether there is a relationship between Diastolic Pressure and Systolic Pressure. Click on the Secondary Findings segment to find out more...

Secondary findings

Since our primary findings were not promising, our group has decided to test out an alternative null hypothesis between diastolic blood pressure and systolic blood pressure readings to see if there is a strong relationship in our study.

For this set, we state that our Null Hypothesis (H0): There is no relationship between a person's diastolic pressure and his/her systolic pressure.

The Alternative Hypothesis (H1): There is a relationship between a person's diastolic pressure and his/her systolic pressure.

Next, we identify the variables:
Diastolic Pressure - A Scale data type
Systolic Pressure - A Scale data type


We then proposed Pearson's R as an appropriate technique to test Hbecause our objective is to find the relationship between the 2 scale variables.

Let's examine the scatter plot to ascertain if the relationship is linear.


Here is our raw data table...

Diastolic pressure in mmHg VS Systolic pressure in mmHg


From the diagram, a Pearson’s correlation coefficient of 0.803 indicates there is a strong, positive and very significant association between a person's diastolic pressure and systolic pressure. Pearson’s r = 0.803, p<0.05, N=30

 The null hypothesis (H0) is rejected.

It is shown here that there is a strong, positive relationship for Diastolic Pressure against Systolic Pressure. Thus, the alternative hypothesis for Diastolic Pressure vs Systolic Pressure was accepted. (We did not generate Systolic Pressure against Diastolic Pressure as the result is the same as the above). This means that there is an association between a person's diastolic pressure and his/her systolic pressure and it is a strong relationship!

Friday, July 29, 2011

Calibration

To ensure that the blood pressure readings that were taken from our subjects were accurate, our team decided to calibrate 2 sphygmomanometers of different brands. We chose to use different brands for our sphygmomanometers to rule out any biasness specific to the manufacturer.

The 2 sphygmomanometers we used in our project were:
1. Osim uCheck 300

2. Omran 1A2

For calibration, three of our groupmates, Sabree, Hui Ting and Yi Xuan, ran one round around NYP's school track and had their blood pressures taken before and after the exercise. All three of them were healthy and had no underlying medical conditions that might affect the readings.

Taking the blood pressure using our first sphygmomanometer, the Osim uCheck 300...

Step 1: Taking the blood pressure before the run


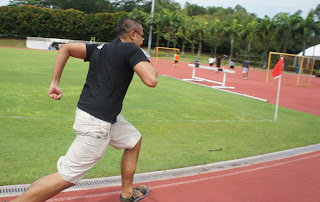
Step 2: Ready, get set... RUN!!!!


It's a pity we couldn't get a wind in hair shot :(


Step 3: Taking the blood pressure again after the run

Hui Ting and Yi Xuan also had their blood pressure readings taken before and after running. We waited for half an hour to cool down before taking the blood pressures again using our second sphygmomanometer. The results were as follows...


The average deviation in readings for the diastolic and systolic pressures were ±2 mmHg and ±2 mmHg respectively. As we planned to use the Osim uCheck 300 to take the blood pressure of out subjects (it was more portable), we had to add 2 mmHg and 2 mmHg to the diastolic and systolic pressures respectively of the readings from our subjects.

Data collection

Time and date: 12 July 2011, Wednesday at 3pm.
Venue: H211

Materials required:
- Our calibrated sphygmomanometer (Osim uCheck 300)
- 2 x measuring tapes
- Declaration forms
- Pen and paper for record taking
- Ruler

Subjects:
- 30 healthy young adults (15 males and 15 females) with no underlying medical conditions
- Between 18 to 24 years old
- 5 subjects from 6 different height groups:
a) 150cm to 155cm
b) 156cm to 160cm
c) 161cm to 165cm
d) 166cm to 170cm
e) 171cm to 175cm
f) 176cm to 180cm

Rationale for the subjects and time chosen for data collection:
We selected our course mates as our test subjects as they fall within the age group of 18 to 24 years old. The readings were taken after our Pathology lecture had ended, which was 2 hours after lunch break. This was to ensure that our test subjects had not engaged in any activities that were physically demanding and were given enough time to digest their lunch so that the readings of their blood pressures would not be affected.

Our team had arranged with the subjects earlier on that we would be collecting their height and pressure readings directly after the lecture. This arranged consent would allow us to collect the data efficiently and the physical condition of the different subjects would not differ too much.

Regrettably, we were unable to find the same number of male and female subjects. It would have been ideal, but the focus of our project was to find out if there was any relationship between height and blood pressure and as such, gender was not a major component of our variables. In the end, we managed to find 18 female and 12 male subjects.

Process of collecting the data:
We had discussed on the sequence and flow of data collection beforehand and our roles were assigned as such:

Yi Xuan: Photographer for the day. She was tasked with taking pictures while we were carrying out the collection of the data. The photos contributed to the visual element of our blog so you won't feel overwhelmed by the sea of words here :P

Jodie (Yan Wei) and Hui Ting:  In charge of height measurement area. Jodie took the height of our subjects while Hui Ting did the recording.

Xin Hui and Fadilah: In charge of blood pressure readings. Xin Hui took the blood pressure of our subjects while Fadilah did the recording.

Sabree: Tasked with coordinating and directing our subjects so that we could take the blood pressure and height readings smoothly. This would also ensure that the process of data collection was efficient.

The set-up of our height measurement area included taping 2 measuring tapes vertically against the wall. As the measuring tape was only 150cm, it was not feasible to tape it against the wall with the tape starting from the floor. Therefore, we measured 100cm first and taped the 10cm point starting from the 100cm mark. This was done so as to eliminate the possibility of zero error, as the 0cm mark could have been affected by previous usage. The same set up was done for the second measuring tape and we took the average height from both readings to minimise errors.

Before the readings of the height and blood pressure were taken, Sabree distributed a form to our subjects to declare that they were suitable candidates for data and that they were giving us their informed consent that their readings would be used for our project.


Sabree arranged the sequence of the subjects and we soon began taking our readings!


Xin Hui was tasked with putting on the sphygmomanometer for all our subjects to achieve consistency on the data collected and the readings were recorded by Fadilah. Each subject was required to have their blood pressure reading taken twice with the second reading being taken after five minutes. The average of the readings were taken for accuracy and consistency.

Our subjects took their height after taking the readings of their blood pressure.


Jodie measured the height of all our subjects for consistency while Hui Ting recorded their average height.

The entire process went smoothly as we managed to gather the data we had initially planned to collect without much hiccup. Read on to find out if our hypothesis stands!